Average home sale price in the U.S. nears $1 million in higher-priced housing markets
SmartAsset ranked the 100 largest metro areas based on the average home sale prices as of April 2024 to find the most and least affordable places for homebuyers.
Jaclyn DeJohn, CFP
Posted 8/16/24
SmartAsset ranked the 100 largest metro areas based on the average home sale prices as of April 2024 to find the most and least affordable places for homebuyers.
This item is available in full to subscribers.
Attention subscribers
To continue reading, you will need to either log in to your subscriber account, below, or purchase a new subscription.
Please log in to continue
Need an account?
Print subscribers
If you're a print subscriber, but do not yet have an online account, click here to create one.
Online-only subscribers
If you are a digital subscriber with an active, online-only subscription then you already have an account here. Just reset your password if you've not yet logged in to your account on this new site.
Non-subscribers
Click here to see your options for becoming a subscriber.
Average home sale price in the U.S. nears $1 million in higher-priced housing markets
SmartAsset ranked the 100 largest metro areas based on the average home sale prices as of April 2024 to find the most and least affordable places for homebuyers.
Posted
Jaclyn DeJohn, CFP
Sundry Photography // Shutterstock
While the median sale price of U.S. homes is just shy of $421,000 in Q1 2024, homes in some areas more than doubled that average. These expensive places may prevent hopeful first-time homebuyers from investing in the area, making renting – or even moving to a less expensive area – a better alternative. In some cases, high wages and demand keeps the pressure up on a lackluster supply of homes.
With this in mind, SmartAsset ranked the 100 largest metro areas based on the average home sale prices as of April 2024 to find the most and least affordable places for homebuyers.
Key Findings
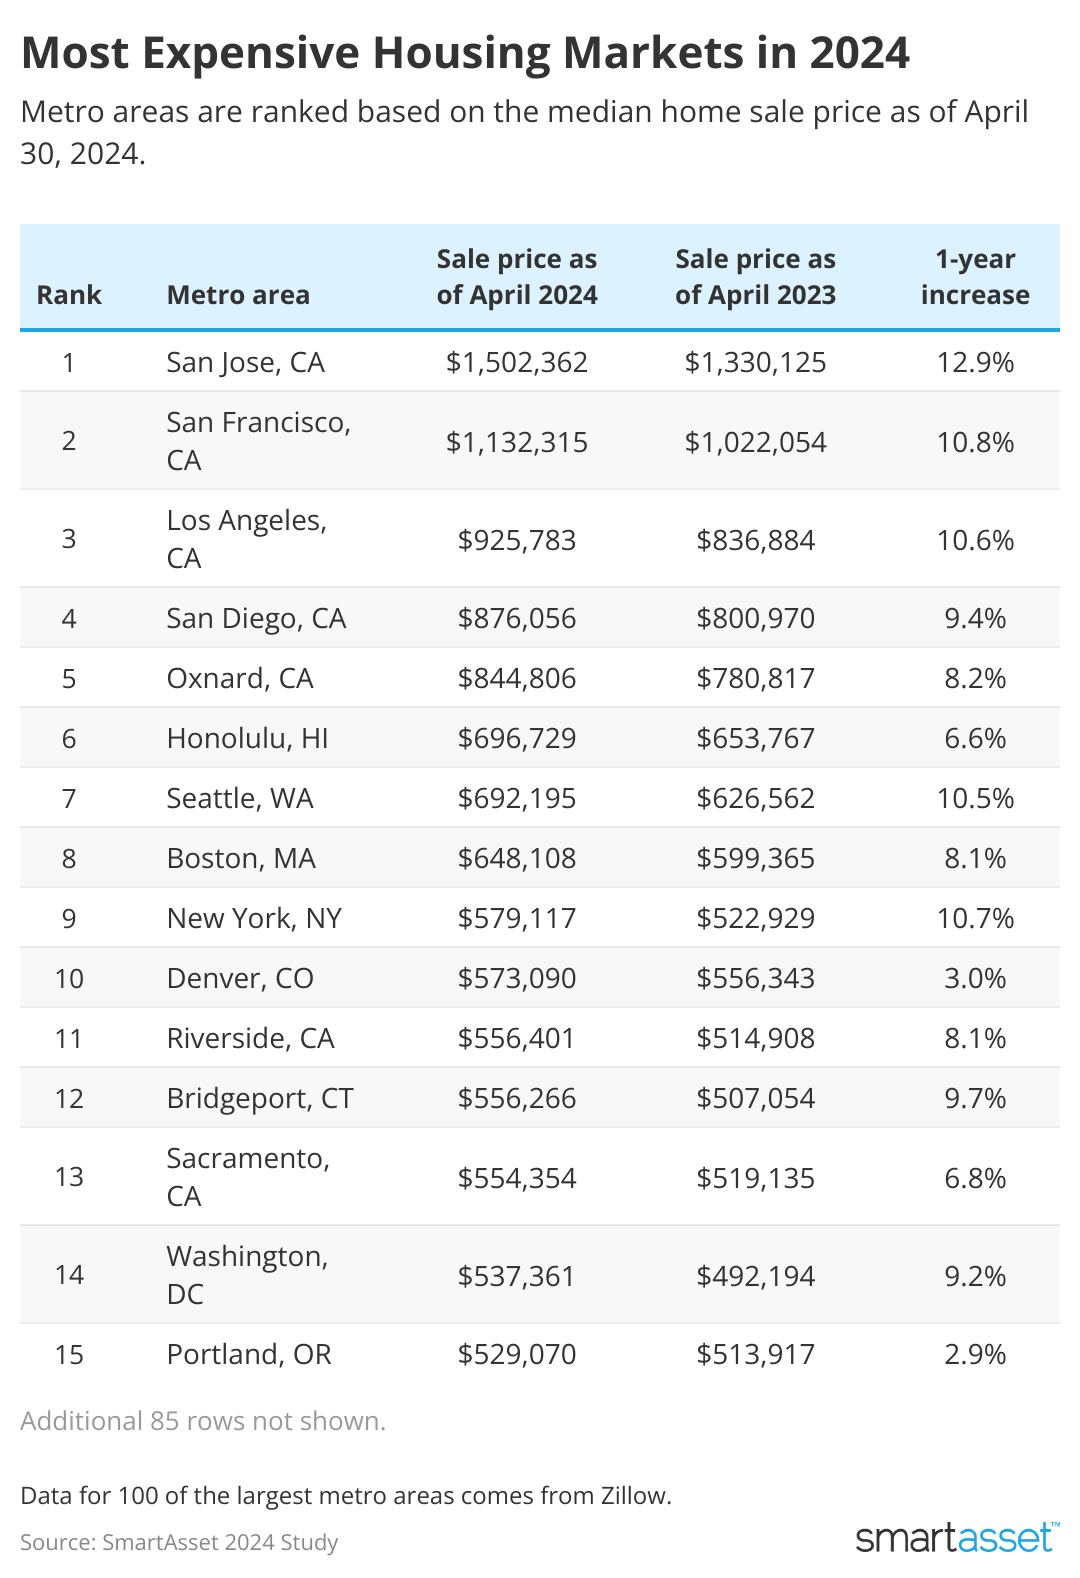
California metros take the top five spots for the most expensive housing markets. Home values in first place San Jose are more than double those in sixth place Honolulu. The average sale price in San Jose was $1.50 million in April 2024, up 12.9% from the year before. San Francisco ($1.13 million), Los Angeles ($926,000), San Diego ($876,000) and Oxnard ($845,000) rank second through fifth.
Homes sell for less than $200k in four Ohio metros. These claim the top of the list for least expensive homes. In 2024, homes average $157,176 in Toledo, $177,000 in Akron, $187,000 in Dayton, and $187,000 in Cleveland.
Home prices have increased by more than 50% since pre-pandemic. Over the last five years, home sale prices in large metro areas have increased by 51.3%. Knoxville, Tennessee, saw the largest increase in this time at 89.5%, while Honolulu saw the smallest relative climb in home prices at 23.4%.
New York City climbs the ranks. In just one year, the New York metro jumped from 12th-most expensive to ninth. Homes sell for about $579,000 as of April 2024, after a 10.7% annual increase. Home prices across all major metros increased by an average 6% in the same time.
Top 10 Most Expensive Housing Markets
SmartAsset
San Jose, CA
Average home sale price as of 4/30/2024: $1,502,362
Price increase over one year: 12.9%
Average home sale price as of 4/30/2023: $1,330,125
Price increase over five years: 41%
Average home sale price as of 4/30/2019: $1,065,478
San Francisco, CA
Average home sale price as of 4/30/2024: $1,132,315
Price increase over one year: 10.8%
Average home sale price as of 4/30/2023: $1,022,054
Price increase over five years: 30.5%
Average home sale price as of 4/30/2019: $867,728
Los Angeles, CA
Average home sale price as of 4/30/2024: $925,783
Price increase over one year: 10.6%
Average home sale price as of 4/30/2023: $836,884
Price increase over five years: 47.9%
Average home sale price as of 4/30/2019: $625,807
San Diego, CA
Average home sale price as of 4/30/2024: $876,056
Price increase over one year: 9.4%
Average home sale price as of 4/30/2023: $800,970
Price increase over five years: 55.1%
Average home sale price as of 4/30/2019: $564,895
Oxnard, CA
Average home sale price as of 4/30/2024: $844,806
Price increase over one year: 8.2%
Average home sale price as of 4/30/2023: $780,817
Price increase over five years: 43%
Average home sale price as of 4/30/2019: $590,774
Honolulu, HI
Average home sale price as of 4/30/2024: $696,729
Price increase over one year: 6.6%
Average home sale price as of 4/30/2023: $653,767
Price increase over five years: 23.4%
Average home sale price as of 4/30/2019: $564,630
Seattle, WA
Average home sale price as of 4/30/2024: $692,195
Price increase over one year: 10.5%
Average home sale price as of 4/30/2023: $626,562
Price increase over five years: 53%
Average home sale price as of 4/30/2019: $452,324
Boston, MA
Average home sale price as of 4/30/2024: $648,108
Price increase over one year: 8.1%
Average home sale price as of 4/30/2023: $599,365
Price increase over five years: 47.9%
Average home sale price as of 4/30/2019: $438,282
New York, NY
Average home sale price as of 4/30/2024: $579,117
Price increase over one year: 10.7%
Average home sale price as of 4/30/2023: $522,929
Price increase over five years: 49.2%
Average home sale price as of 4/30/2019: $388,273
Denver, CO
Average home sale price as of 4/30/2024: $573,090
Price increase over one year: 3%
Average home sale price as of 4/30/2023: $556,343
Price increase over five years: 45.3%
Average home sale price as of 4/30/2019: $394,302
Top 10 Metro Areas With the Most Affordable Housing Markets
Toledo, OH
Average home sale price as of 4/30/2024: $157,176
Price increase over one year: 16.4%
Average home sale price as of 4/30/2023: $135,009
Price increase over five years: 33.2%
Average home sale price as of 4/30/2019: $118,029
Akron, OH
Average home sale price as of 4/30/2024: $176,757
Price increase over one year: 3.8%
Average home sale price as of 4/30/2023: $170,290
Price increase over five years: 26.6%
Average home sale price as of 4/30/2019: $139,667
Scranton, PA
Average home sale price as of 4/30/2024: $180,387
Price increase over one year: 0.2%
Average home sale price as of 4/30/2023: $179,971
Price increase over five years: 49.7%
Average home sale price as of 4/30/2019: $120,539
Dayton, OH
Average home sale price as of 4/30/2024: $186,913
Price increase over one year: 8.9%
Average home sale price as of 4/30/2023: $171,664
Price increase over five years: 46.9%
Average home sale price as of 4/30/2019: $127,199
Cleveland, OH
Average home sale price as of 4/30/2024: $187,413
Price increase over one year: 5.7%
Average home sale price as of 4/30/2023: $177,352
Price increase over five years: 36.2%
Average home sale price as of 4/30/2019: $137,615
McAllen, TX
Average home sale price as of 4/30/2024: $194,858
Price increase over one year: 1%
Average home sale price as of 4/30/2023: $192,890
Price increase over five years: 32.8%
Average home sale price as of 4/30/2019: $146,774
Syracuse, NY
Average home sale price as of 4/30/2024: $202,329
Price increase over one year: 7.3%
Average home sale price as of 4/30/2023: $188,497
Price increase over five years: 45.2%
Average home sale price as of 4/30/2019: $139,370
Pittsburgh, PA
Average home sale price as of 4/30/2024: $206,620
Price increase over one year: 8.3%
Average home sale price as of 4/30/2023: $190,855
Price increase over five years: 34.7%
Average home sale price as of 4/30/2019: $153,409
Little Rock, AR
Average home sale price as of 4/30/2024: $213,760
Price increase over one year: 3.4%
Average home sale price as of 4/30/2023: $206,806
Price increase over five years: 43.1%
Average home sale price as of 4/30/2019: $149,363
Rochester, NY
Average home sale price as of 4/30/2024: $216,291
Price increase over one year: 10.6%
Average home sale price as of 4/30/2023: $195,542
Price increase over five years: 52.9%
Average home sale price as of 4/30/2019: $141,458
Data and Methodology
This study examined home sale data for 100 of the largest metro areas in the U.S. to determine the most and least expensive housing markets. Data for April 2024, 2023 and 2019 comes from Zillow for single-family homes, condos and co-ops.
This story was produced by SmartAsset and reviewed and distributed by Stacker Media.